
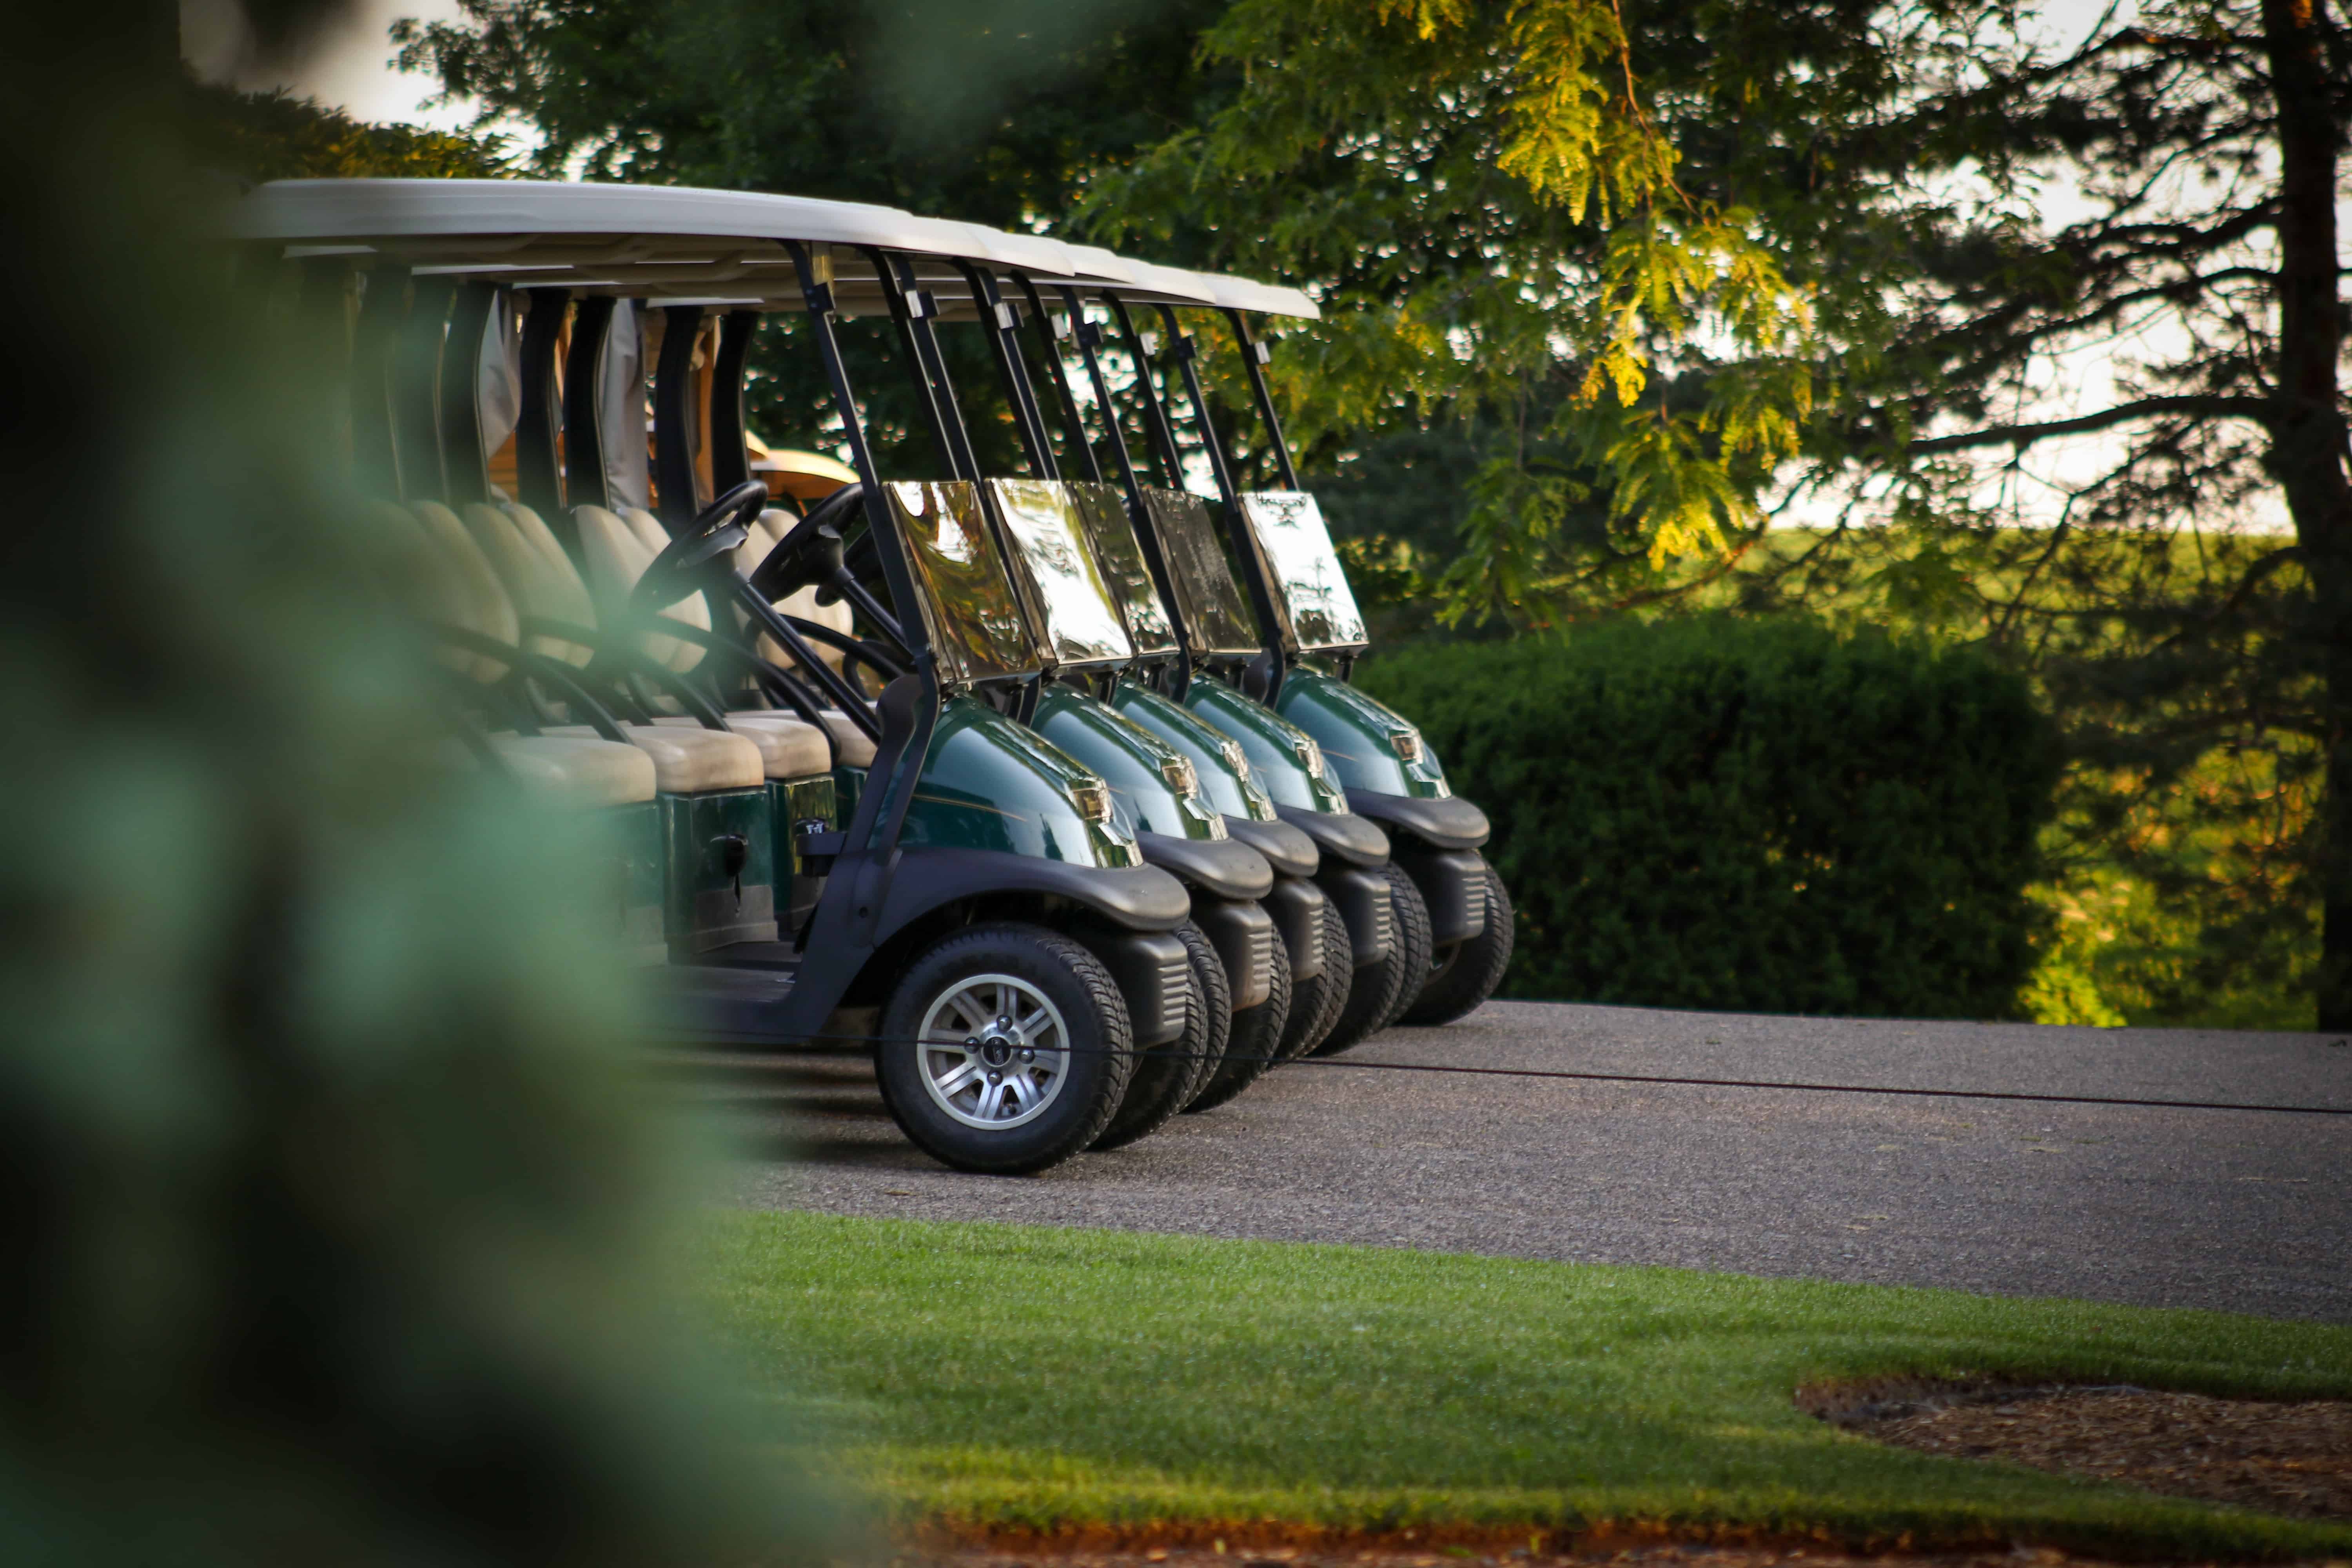
Practicing your swing at the local driving range may be considered a leisurely endeavor, but this niche business has its particular challenges for the entrepreneur. With an economic impact upwards of $60 billion, the golf industry is entering a mature phase and new entrants at all levels are looking at unique circumstances. In some areas, golf facilities have saturated the market so that facility owners are faced with overcapacity.
Sources:
The Society of Golf Appraisers – https://www.golfappraisers.com
2002 Golf Economy Report, Golf 20/20 – https://www.golf2020.com/
Golf driving ranges are classified as alternative golf, a segment of the larger golf industry. In a benchmark report commissioned for the Golf 20/20 Conference in 2001, golf ranges and other alternative facilities were studied in detail for the first time. In 2001, stand-alone driving ranges numbered 2,805 – a full 50% of all alternative facilities in the United States. According to the Reference USA database there are a total of 2,806 companies listed as driving ranges in 2004. Of these, only 1,466 companies were listed with driving ranges as their primary line of business.
Previously, the development, construction and popularity of golf driving ranges experienced much the same growth as the overall golf market. Starting in the 90’s, stand-alone driving ranges grew in number at 11% in 1990 to 13% in 1993 and settling at 6% in 1996. According to Golf Research Group, the development in the industry is lackluster – with approximately 50 new ranges being built and around 50 ranges disappearing each year.
Source: US Driving Range Survey 2003 – https://www.golf-research-group.com/reports/report/4/content.html
Alternative Facilities Overview
In 2001, Alternative Facilities totaled 5,542. Selected details on driving ranges follow:
| Driving ranges (stand alone) | 2,805 | 50% |
| Executive Courses | 865 | 16% |
| Par Three | 1,653 | 30% |
| Pitch and Put | 160 | 3% |
| Others of | 59 | 1% |
| Various configurations | ||
| Total | 5,542 | 100% |
Selected states with the greatest number of driving ranges compared to total golf facilities market:
| Texas 218 | New York 183 | Michigan 176 | Pennsylvania 174 | Florida 147 | California 142 |
Selected states with the largest percentage of driving ranges compared to total golf facilities market:
| Connecticut 25.7% | New Jersey 23.0% | Maryland 22.8% | Massachusetts 22.5% | New Hampshire 20.4% | Delaware 19.6% |
Location, Location, Location
The proposed location of the driving range is a key consideration. Approximately, 80% of customers will come from within 15 minutes drive of the range. Along with other key factors, e.g., per capita income and population density, driving range development can follow much of the criteria needed for a successful golf course. As a matter of fact, “alternative and traditional facilities are complements, and they go hand in hand to produce a thriving golf market.”
Source: 2001 Alternative Facilities Report, Golf 20/20 – https://www.golf2020.com/
Top Facility Amenities
| Amenity | % of Driving Ranges Offering Each Amenity |
| Putting Greens | 75% |
| Snack Bar | 42% |
| Chipping Areas | 69% |
| Miniature Golf | 40% |
| Retail Pro Shop | 65% |
| Batting Cage | 23% |
| Practice Bunker | 58% |
| Restaurant | 15% |
Facility Operations 2000
| Driving ranges | Total Revenue ($ millions) | Average Revenue |
| 2,805 | $661.8M | $236,000 |
Source: 2002 Golf Economy Report, Golf 20/20 – https://www.golf2020.com/
The US Driving Range Survey 2003 reports approximately 18% of all golf ranges generate a profit margin of 35% or greater. On the other end of the spectrum, 28% generate a profit margin of 20% or less.
Range Prices
- 20.1 % of ranges charge 9.5 to 10 cents per ball for a small bucket (cents per ball method)
- 27.4% of ranges charge between $3.50 and $4.00 for a small bucket
Source: US Driving Range Survey 2003 – https://www.golf-research-group.com/reports/report/4/content.html
Golf Participation on the Upswing
Reports published during the first quarter of 2004 reveal a 5.3% increase in golf rounds played. ”… after two years of declines due to the weak economy, a shaky employment picture, worldwide unrest and poor weather, recent gains in golf rounds are welcome.” These indicators signify general improvement for golf driving ranges, as well as, other alternative golf facilities.
Demographic Highlights
Best Customer: Male; 40-64 years old; income greater than $75,000; lives in larger (2 million +) metropolitan areas; no small children at home. There are:
- 36.7 million golf participants, (age 5+ who either played a round or visited a golf facility)
- 26.2 million golfers in the United States (age 18+ playing a regulation round of golf)
- 11.9 million (or 45%) are between the ages of 18 and 39
- 8.6 million (or 33%) are ages 50 and over
- 1.4 million (or 10%) of golfers are Hispanic
Source: National Golf Foundation, https://www.ngf.org
Future Customers
In the 2004 Industry Report by Golf 20/20, released in June 2004, golf’s best potential customers have been clearly identified. These demographic categories are youngsters, women and ethnic minorities. The industry will be dependent on this new fan base for introducing new recruits to the game of golf.
Marketing efforts are now friendly to the entire family, akin to making the driving range a family entertainment venture. Additional amenities at driving ranges, e.g., batting cages and miniature golf will play a hand in exposing the recreational pastime to these previously overlooked demographic components.
- 6.1 million of all golfers are age 5-17 (juniors)
- 5.76 million of all golfers are female
Exclusive Range Users who did not play on a regulation or alternative facility course:
| Total in U.S. | African American | Hispanic American | Asian American |
| 3,100,000 | 162,000 | 110,000 | 59,000 |
Source:
2004 Industry Report and 2003 Minority Golf Participation in the U.S., Golf 20/20 – https://www.golf2020.com/
Websites of Interest
Golf Range Association of America – https://www.golfrange.org/
Golf Course Builders Association of America – https://www.gcbaa.org/WELCOME.asp
National Golf Course Owners Association – https://www.ngcoa.org/
Golf Range Times – https://www.golfrangetimes.com
Golf Business Magazine – https://www.golfbusiness.com/
This material is based upon work supported by the U.S. Small Business Administration. Any opinions, findings, conclusions or recommendations expressed are those of SBDCNet and do not necessarily reflect the views of the U.S. SBA. This U.S. Small Business Administration (SBA) Grant is funded by the SBA. SBA’s funding is not an endorsement of any products, opinions, or services. All SBA funded programs are extended to the public on a nondiscriminatory basis. This material may be protected by Copyright law (Title 17 U.S. Code).