Geographic Information Systems (GIS) use maps to provide a visual representation of information from select market areas. They are powerful decision-making tools for big business (commonly known as “business intelligence” tools), but their high cost has kept them out of reach for small businesses – until now.
Working through your local SBDC Advisor, SBDCNet can provide you with these same powerful tools used by big businesses at no cost to your business. Below is a small sampling of the GIS maps and reports we can provide. To get started using this system, please contact your local SBDC.
GIS Ring Study Analysis
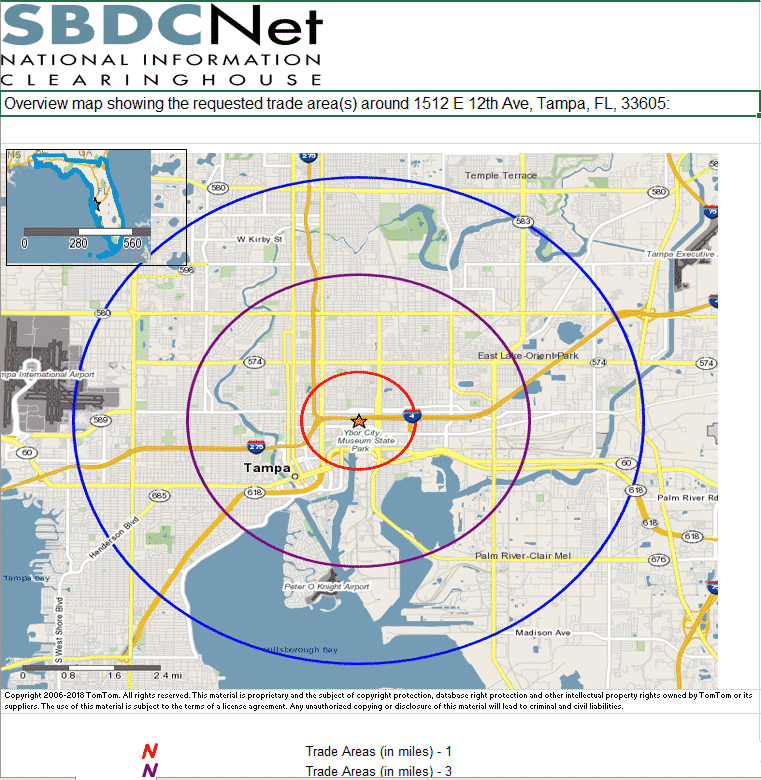
Our most frequently requested GIS offering, a ring study will take your given address or intersection and collect data in a search area composed of three rings centered on that location. Information provided includes demographics, consumer behavior, and spending gathered about the area in the given search radius and displayed in reports, maps, and lists for you to use in your business planning process.
As an example, an auto repair shop can use the Ring Study Analysis to identify the annual household spending on automotive repairs and percent of households with one or more vehicles.
The default trade area search consists of a 1, 3, and 5-mile radius, but at your advisor’s request, we can expand or shrink the search area depending on your business needs.
Sample: 1,3, 5-mile Ring Study for specified trade area
Sample Ring Study Analysis
GIS Drive Time Analysis
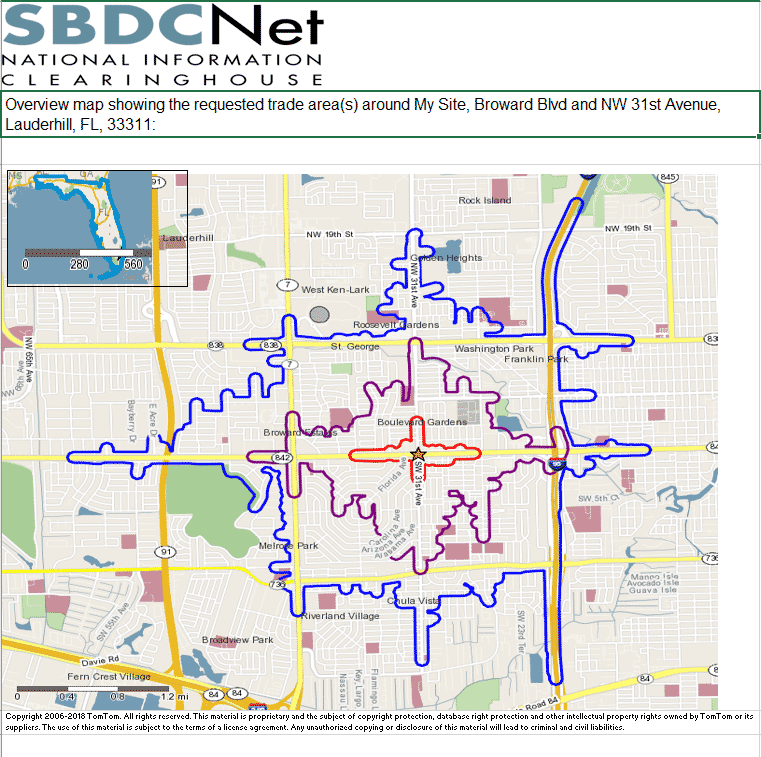
The time it takes to travel to a local business can be a significant factor in defining the target market for a small business. Much like a Ring Study Analysis, a Drive Time Analysis will center a search area around your given address or intersection then map the distance as a drive time, taking into account speed limits, traffic, and routes.
As an example, in response to the challenges of the Coronavirus pandemic, many restaurants pivoted to delivery. A pizzeria could utilize information from a Drive Time Analysis to better understand the annual expenditure of lunch and dinner of households within their delivery service area.
The following is a sample of a Drive Time Analysis map showing which market areas can reach a small business destination within 5, 10, and 15-minute drive times. These are the standard drive times used in requests, but your advisor can request other drive times based on your needs.
Sample: 5, 10, 15-mile Drive Time for specified trade area
Sample Drive Time Analysis
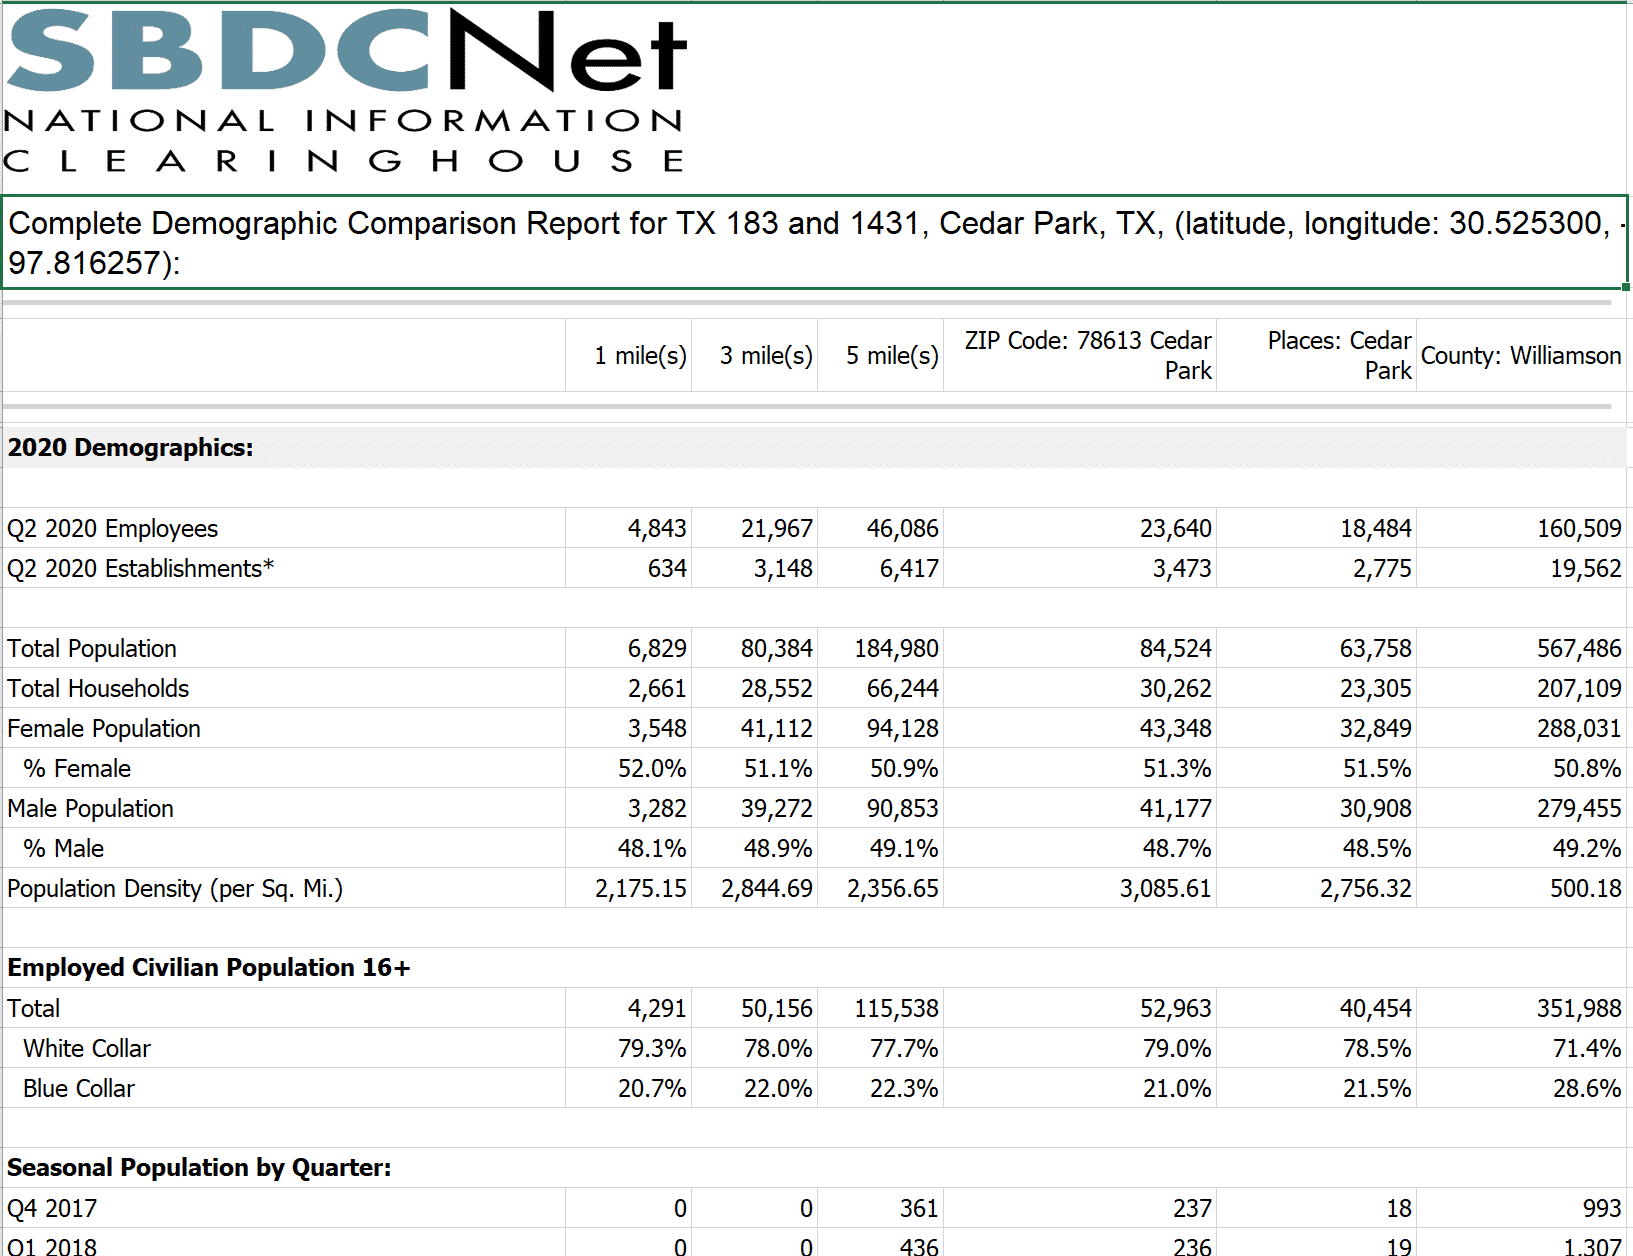
GIS Geographic Comparison
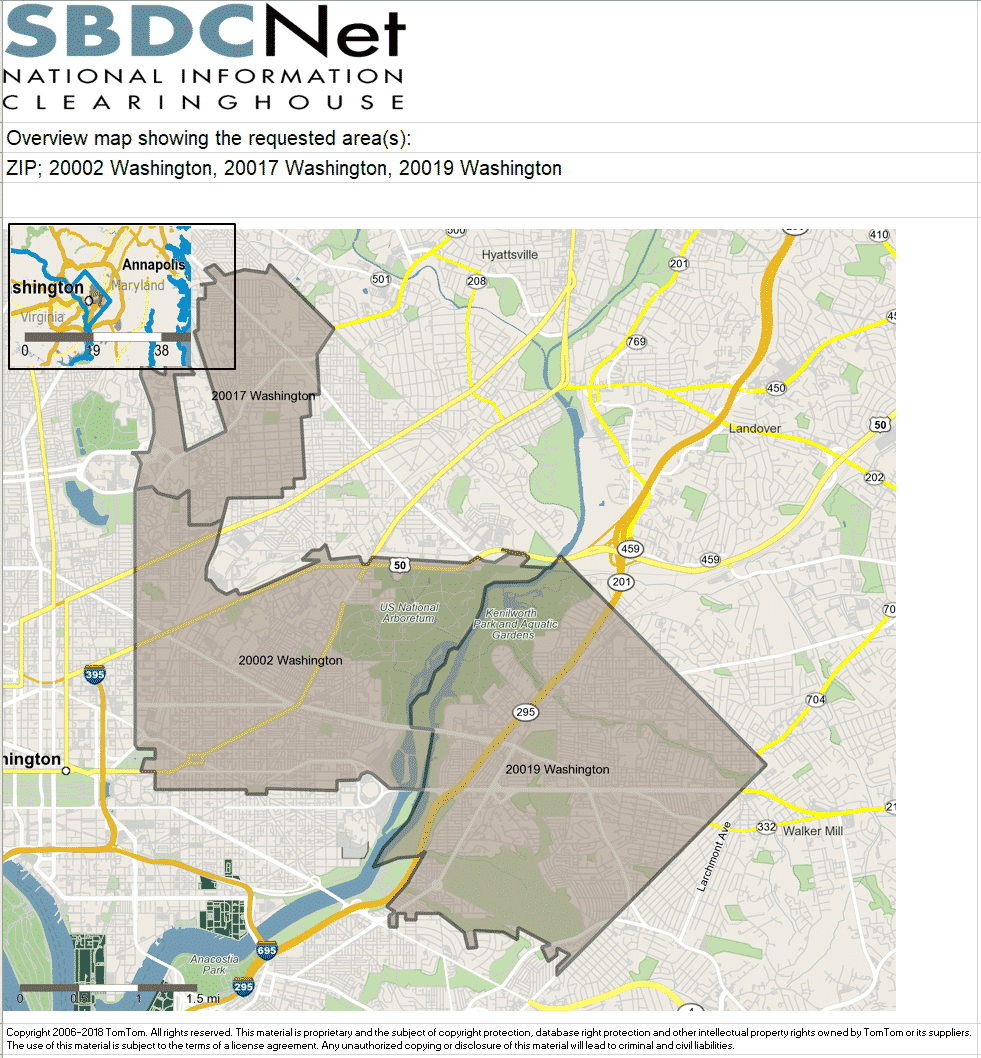
Should you need to know data broken down by ZIP codes or counties, for situations such as site selection, assigned territories, or geographic restrictions, SBDCNet can also provide data separated by those boundaries.
It is very important that you provide your advisor a list of the varying geographies (ZIP codes or counties) when they request research from SBDCNet to ensure the correct data is provided.
As an example, for a daycare center trying to identify the best location to open their facility, the Geographic Comparison would help the owner compare the market of two or more geographies, typically done at the zip code-level. This analysis provides side-by-side comparison of data like household size, percent of household population by age, and annual household spending on child care to help identify which area may be best suited for this type of business.
Sample: comparison of a 3 ZIP code trade area
Sample Geographic Comparison
Competitor Map
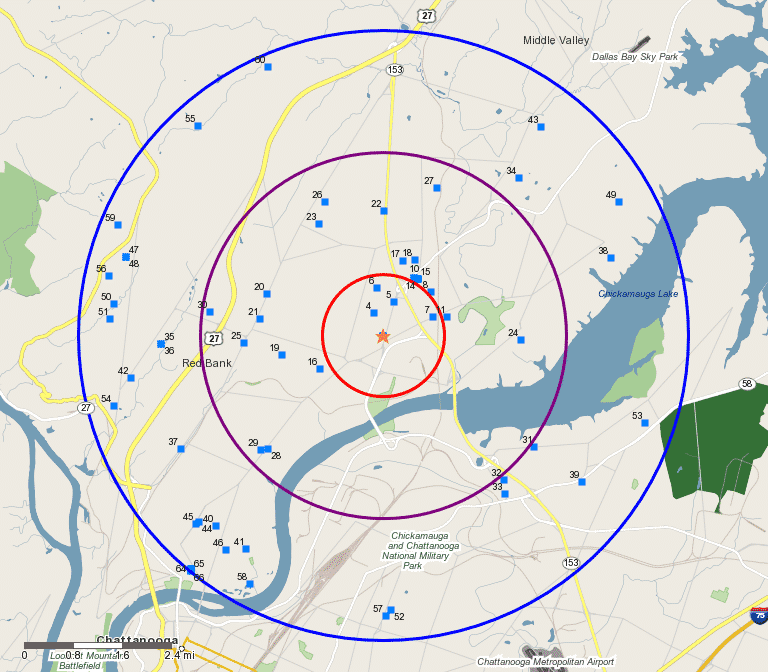
An understanding of local competition is another important aspect to running a business. Too much competition can prevent growth or even doom a business from the start. Your GIS report will include a competitor map displaying local competition, based on NAICS or SIC code. The previously discussed GIS ring study or GIS drive time search area will determine the search area.
SBDC Advisors can order a competitor location map to help their small business clients get a better grasp of their competitive landscape and pinpoint market opportunities.
Map of Competitor Locations
Sample of competitor map
Sample Competitor Map
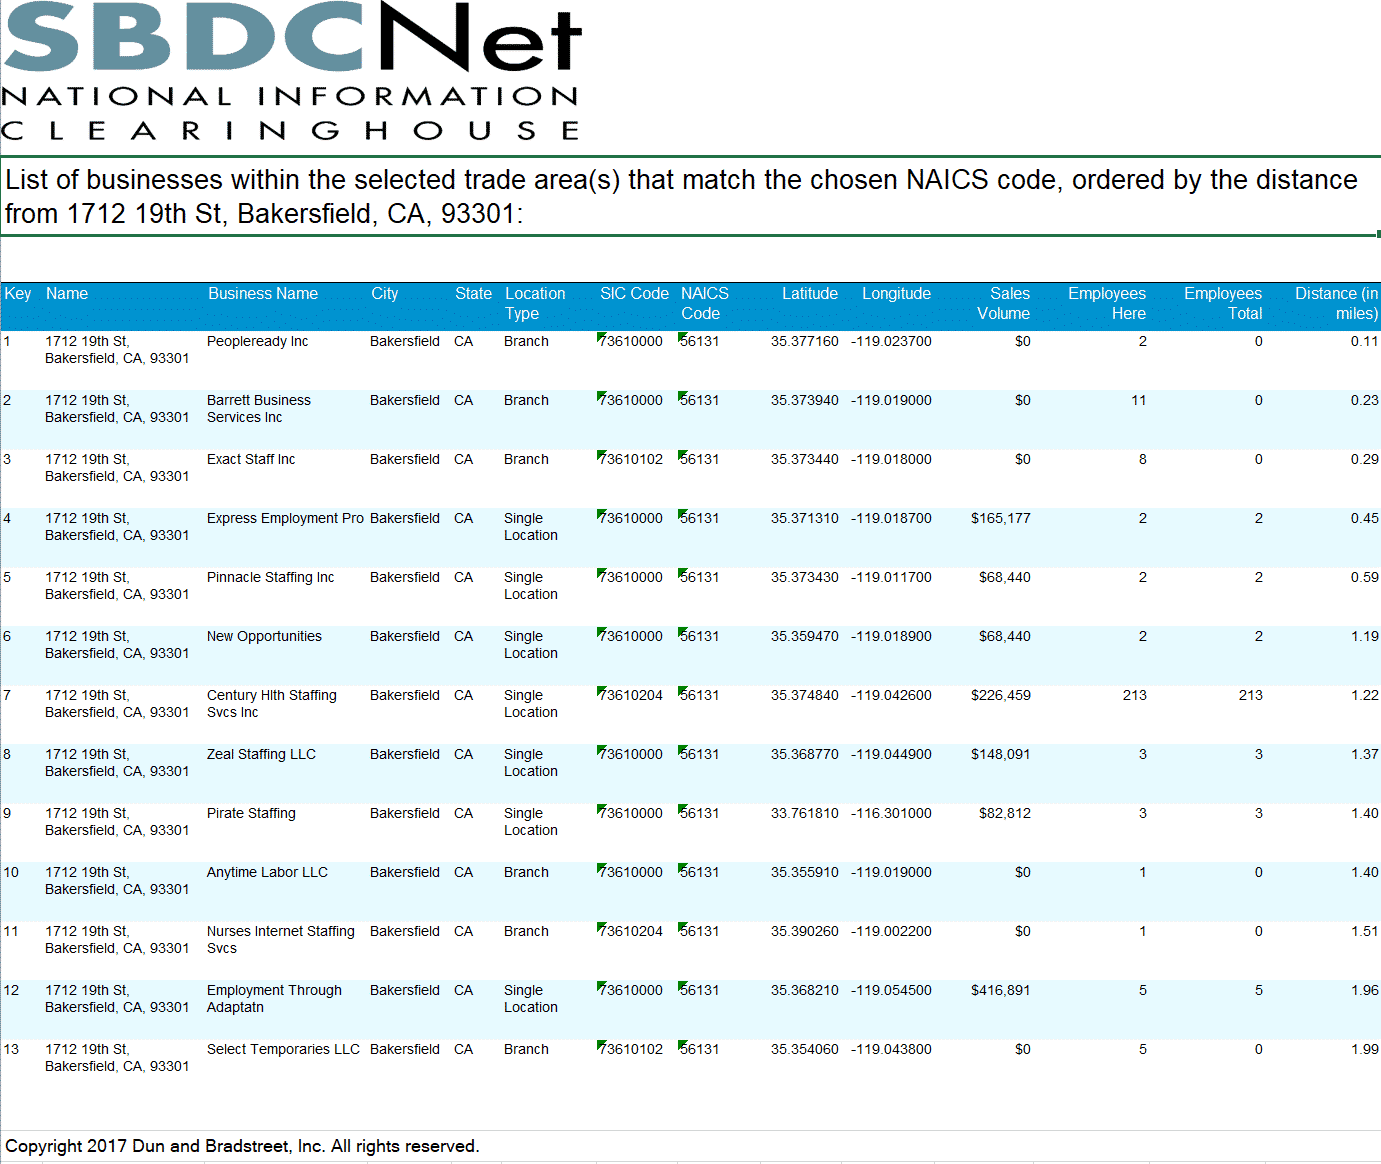
Competitor List
GIS reports includes a list of competitors identified in the Competitor Map.
A competitor list typically includes:
a competitor’s company name
business address
number of employees at each location
whether the location is a competitor’s single location or branch
estimated annual sales volume
the competitor’s NAICS and SIC code
latitude and longitude coordinates.
Sample of competitor list
Sample Competitor List
Demographic Reports
With your GIS research, SBDCNet will provides a wide variety of reports on important demographic indicators, including:
population
consumer spending
income levels
number/type of households
number/type of housing units
educational attainment
employment status
marital status
motor vehicle ownership
and many more.
Demographic reports include current data and estimates trend data for these indicators. We can also provide comparisons between the local market, ZIP code, city, county, state, or the nation.
These reports can help small business owners better understand their local market. When used in conjunction with some of our location-based reports, the small business owner can forecast business trends at new locations, refine their marketing plan, and have a better understanding of local market conditions.
Sample Demographic Comparison Report
Sample Demographics Report
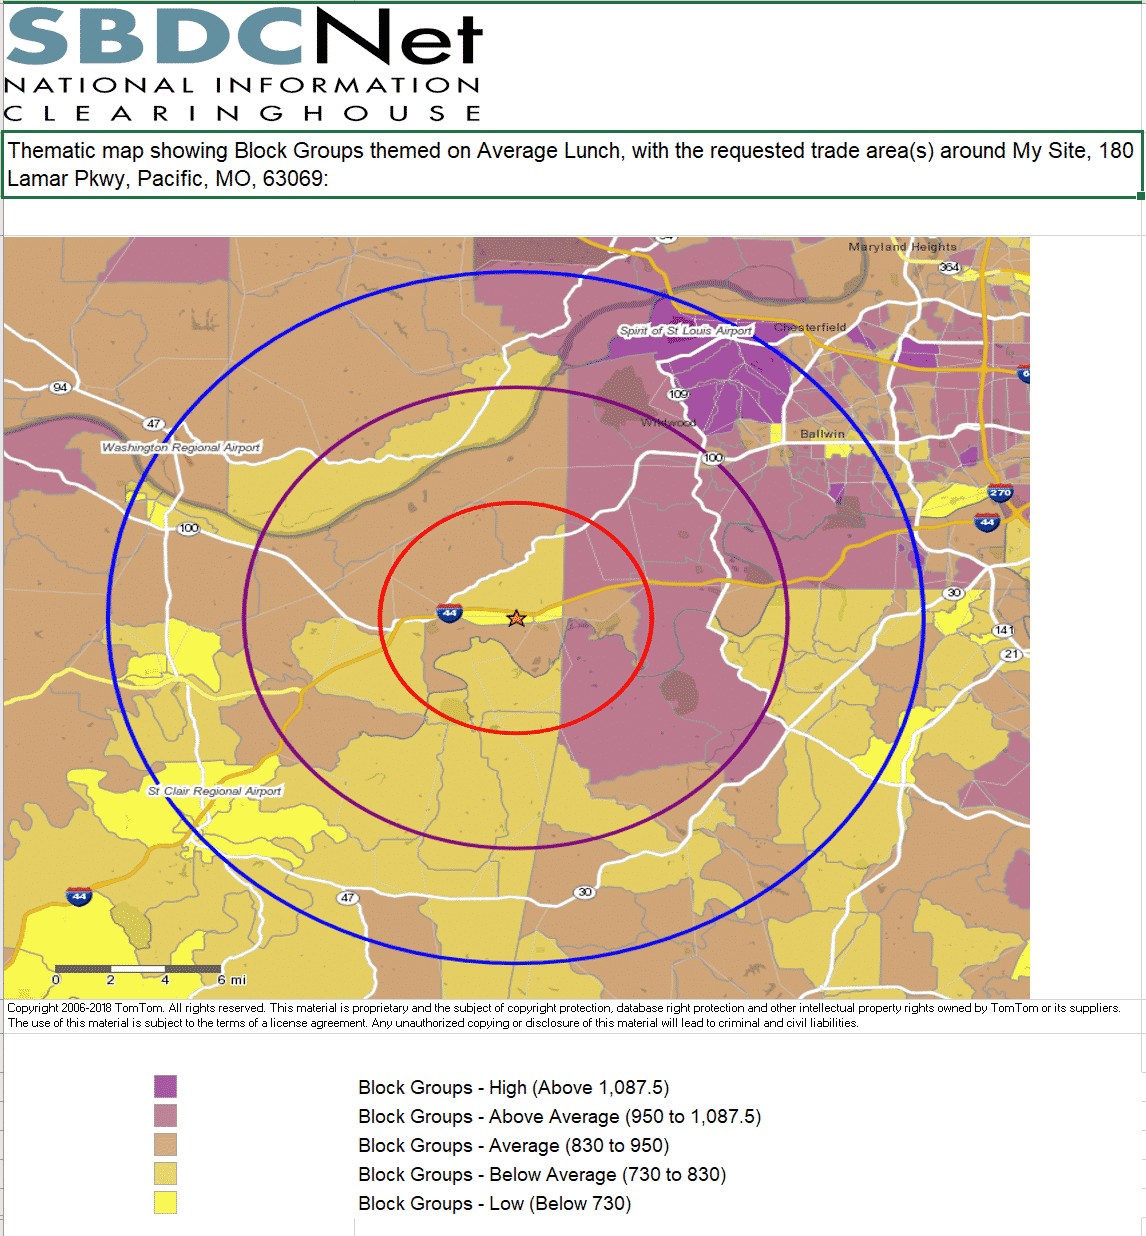
Theme Map
A GIS theme map will be included in the GIS report provided to you and your advisor. This turns one of the aforementioned demographic variables into a quick and easy to read “heat map” rather than a number on a spreadsheet.
This map and accompanying report shows average household annual expenditures on different types of products or services. It also provides data on the number of households and income levels. Your SBDC Advisor may use this report to help clients visualize and evaluate the relative demand for their chosen industry within their local market area.
Sample Thematic Map
Annual household expenditures for a requested retail category (spending on lunch), by Census block group.
Darker areas denote areas where households spend more.
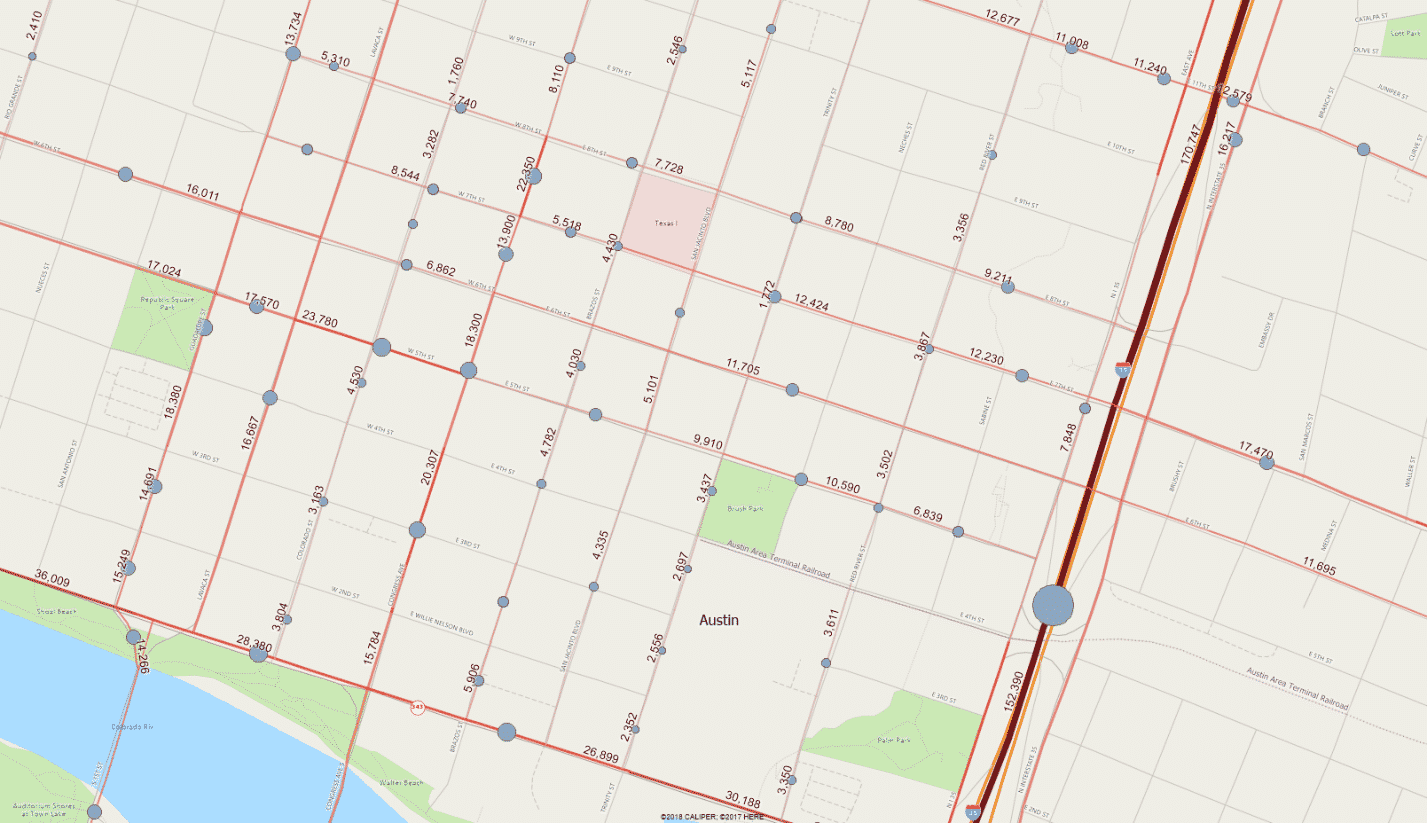
Sample Thematic MapTraffic Counts
Understanding the amount of potential vehicle traffic passing by a location is also a crucial consideration for identifying a business location. Every vehicle that passes your business is a potential customer. With this information coming directly from your state’s Department of Transportation (or equivalent) and displayed on an easy to read local map, you will be able to get a large amount of actionable data about a location.
Sample traffic counts data for downtown Austin, TX.
Sample Traffic Counts
SBDCNet Mapping Services
These tools provide data visualization critical to entrepreneurs in providing an understanding of the target market for their business-to-consumer endeavors. In requesting this information from your advisor, it is important to provide the address or intersection of the proposed or existing business location to identify the most accurate information. With information provided through our GIS Mapping Services, small businesses are better positioned to make more informed data-driven decisions.
These reports are provided at no-cost to prospective or existing small business owners who are receiving business advising services from their local SBDC Advisor.